Unusual Options Activity (UOA) is defined as when a stock’s options contracts are trading at a higher volume than its average daily volume. Typically the trades are at least twice more than its average daily volume but can go as high as 10x in serious cases of unusual options activity.. Unusual volume occurs right before a stock is going to make a big move. It is typically driven by major investors invested in a stock and causing it to drive up or down.
A classic case of Unusual Options Activity is with recent meme stocks. Meme stocks are stocks whose prices are driven higher purely by investor activity. In this case, many new investors on social media banned together to decide to drive a stock to extraordinary new highs by all buying in.
So, let’s take a closer look at UOA, how you can spot it, and how you can use it to help trade options.
Let’s get one thing cleared up. Trading on Unusual Options Activity alone is not a great idea. You should have a clear understanding of investing and take the time to learn how to trade options before using unusual activity volume in your trading strategy.
Much like sentiment indicators, momentum indicators or any other technical analysis indicators, unusual options activity should be a component of your trading strategy. There is no real way of knowing what is driving unusual options activity, but for the most part, they are usually driven by major institutions or major investors who are hedging the downside of their positions through options buying.
Institutions may hedge their positions for a variety of reasons. Some of these reasons are transparent to the public and some of them are unknown. These reasons are known as catalysts. The transparent catalyst may be events like an Earnings Report. Unknown catalysts are not readily available to the public but the major investor gets wind before it’s widely known.
An example of this would be the 2008 financial crisis where the mortgage industry collapsed. Here, a hedge fund manager (made popular in the movie The Big Short) realized the housing bubble ahead of time and shorted the housing market for unprecedented gains. Now, this is a major example of Black Swan Event but you get the picture.
One of the main problems that occurs when trying to trade on UOA, is that there is a ton of guess work that goes into predicting the direction of the stock ahead of the trade. The first thing you should do when you notice Unusual Options Activity on a stock is to check out the news on it. See if you notice any potential Black Swan events that could negatively impact the stock price. Conversely, there may be a ton of positive sentiment around upcoming earnings that could predict a positive movement.
There is no true way to be sure that UOA is Bullish or Bearish on a stock. That is why it is crucial to use other indicators to analyze a stock’s direction before placing a trade.
Using a sentiment indicator in your technical analysis can provide you insight into the potential direction of the stock while Unusual Options Activity is occurring.
And the Put/Call Ratio is an excellent sentiment indicator as it is a simple barometer of this prevailing market sentiment.
The Put/Call Ratio (PCR) is simply the total volume of puts purchased over a specific period of time divided by the total volume of calls purchased in that same period. The CBOE (Chicago Board Options Exchange) provides this information on a daily basis.
A Total PCR reading above 1 means that investors are purchasing a larger number of puts than calls, indicating a bearish outlook. Conversely, A Total PCR below 1 is bullish (more call buyers).
Another great indicator to use in conjunction with Unusual Options Activity is a momentum indicator.
Momentum Indicators measure the rate of change of the price of a security: how high (or low) a stock moves and how fast. This determination of the velocity of the price move allows investors to ride a continuation of the momentum while seeking potential inflection points or trend reversals.
Moving averages are the most basic of Momentum Indicators. A Simple Moving Average (SMA) is the average price of an index or stock over a certain period. The time period remains the same, but the average continuously “moves” with the addition of the next time increment. They are plotted as a continuous line on a Bar Chart and visually display the overall trend of the security.
Taking the time to learn options trading and develop a sound technical strategy will greatly increase the chance of success when leveraging Unusual Options Activity.
Once you feel comfortable using Unusual Options Activity as a component of your trading strategy, you need a tool to help you find it.
Two popular tools that can help you find UOA are:
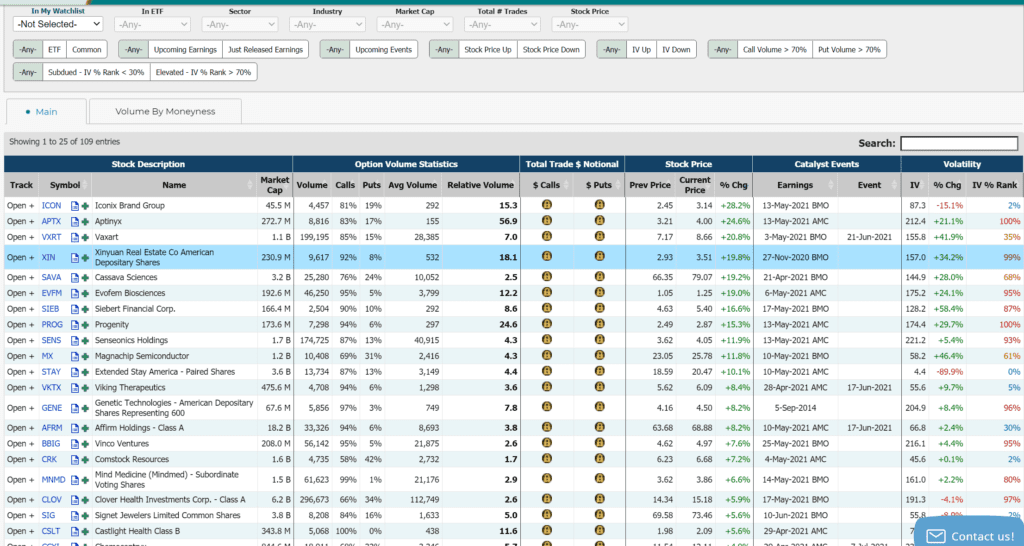
Market Chameleon finds stocks that are trading higher on daily relative averages and allows you to to sort on a variety of features to determine an outcome.
It is a very user friendly tool that shows you Volume Statistics, Catalyst Events, and Volatility of a stock that has UOA.
Market Chameleon’s premium subscription even gives you detailed options strategies to use on a stock that has Unusual Options Activity.
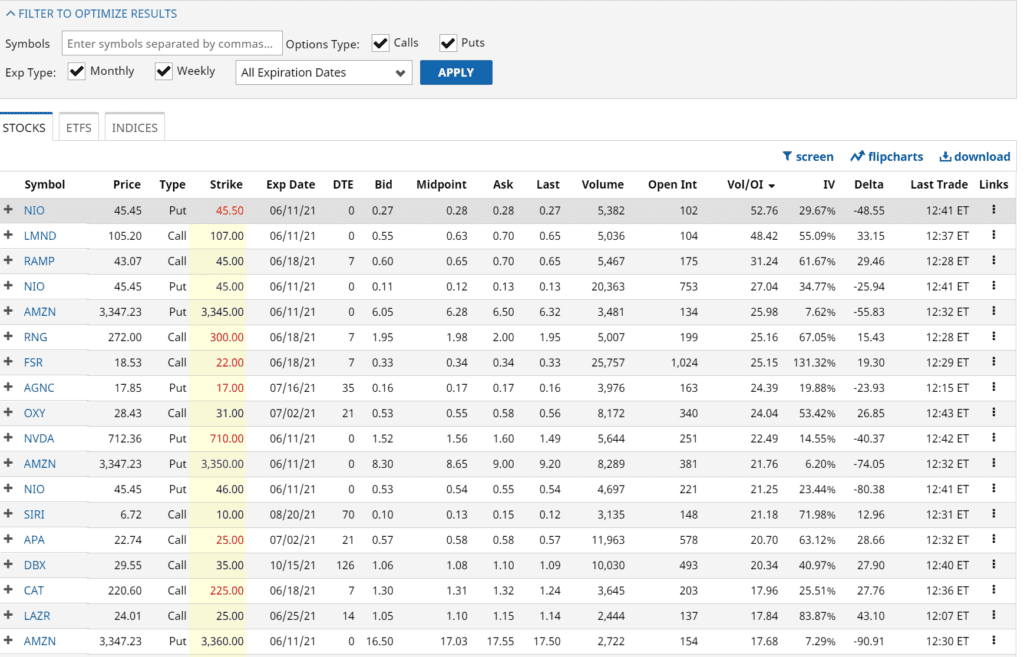
Barchart is another tool that allows you to scan for UOA. Similar to Market Chameleon, Barchart gives you a screener of stocks that allows you to sort by Volume, Open Interest, Volatility and more.
In summary
Wealthplicity Recent Posts