As we have mentioned before, Technical Analysis presupposes that all of the necessary information – fundamental data and expectations – for investors to make rational decisions are found in price and volume. Indicators such as Index Indicators, Volume Indicators and Momentum Indicators all play a role in predicting price movement in a technical analysis. However, there are also technical indicators that measure the emotional and psychological components that are embedded within all markets. A Market Sentiment Indicator gauges the fear and greed, the hope and despair, the bullish and bearish outlooks that drive the markets and fuel periodic extremes. A number of useful Market Sentiment Indicators are:
Options are at their core a one directional bet on the price of a stock or index. They do not consider dividends, diversification or asset allocation. An investor purchasing a call expects a rally, and a put buyer sees an imminent selloff.
The options market, therefore, provides an indication of the overall market’s expected outlook. And the Put/Call Ratio is an excellent sentiment indicator as it is a simple barometer of this prevailing market sentiment.
The Put/Call Ratio (PCR) is simply the total volume of puts purchased over a specific period of time divided by the total volume of calls purchased in that same period. The CBOE (Chicago Board Options Exchange) provides this information on a daily basis.
While the CBOE maintains index, ETF and equity ratios, investors should focus on the Total Put/Call Ratio, which combines all the various investment vehicles. Its broad nature reduces the bias and noise found in the others.
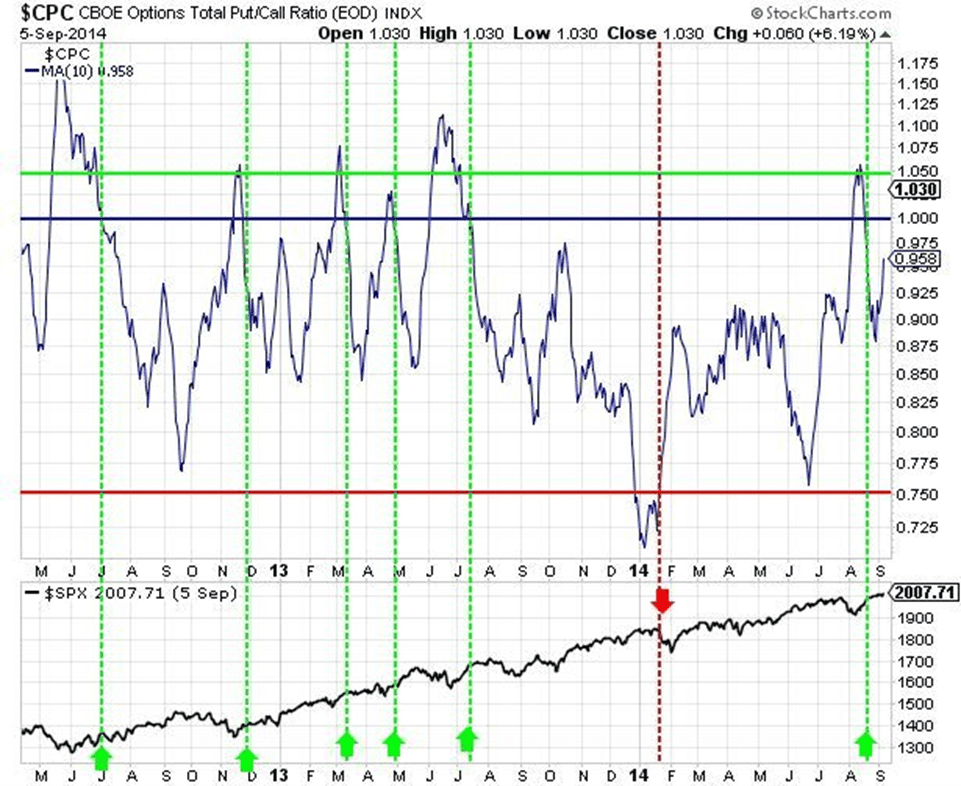
A Total PCR reading above 1 means that investors are purchasing a larger number of puts than calls, indicating a bearish outlook. Conversely, A Total PCR below 1 is bullish (more call buyers).
As its daily readings can be volatile and hard to interpret, utilizing a Simple Moving Average will smooth the data. Similar to many other technical tools, the value of the PCR is found in the extremes. Investors are looking to take advantage of those outlying values displaying extremely bullish or extremely bearish conditions.
In extended markets, investors’ appetite for risk increases as they continue to chase elusive returns. The demand for higher yielding corporate bonds – known as junk bonds – is another sentiment indicator that is a sign of a bullish market. Formerly considered unsuitable as investments due to their risk of default – hence the name “junk” and the high yields – investors’ need for return, especially in low interest rate environments, has brought the junk bond market into the mainstream.
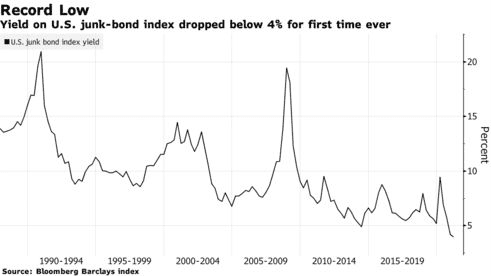
Again, extreme low or high values are indicative of overly bullish or bearish sentiment. The 1990 recession and the 2008 Financial Crisis diminished junk bond demand and pushed their yields to recent extremes, which proved to be market bottoms. A regular observation of their demand (yield) trend will be helpful for investors looking for potentially overly bullish or bearish markets.
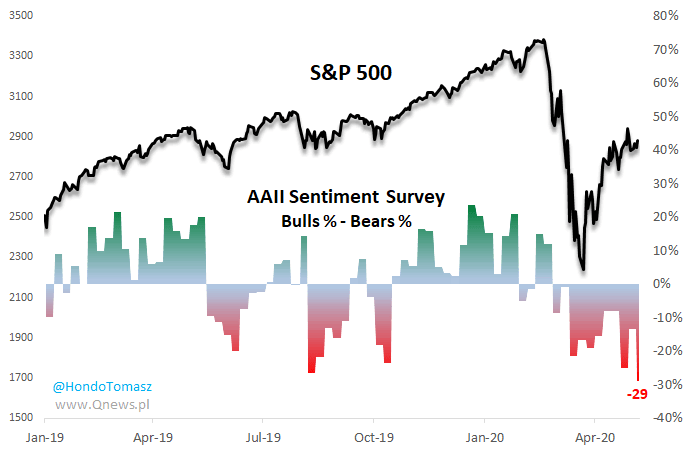
The Bull/Bear Ratio is a weekly survey by the American Association of Individual Investors. Since 1987 it has simply asked its approximately 150,000 members “Where do you see the market in the next six months?” with bullish, bearish or neutral the only possible responses.
The percentages of bulls and bears provide a read on the overall mood of the individual investor. Results in the extremes (50%+) indicate an overly bullish or bearish outlook.
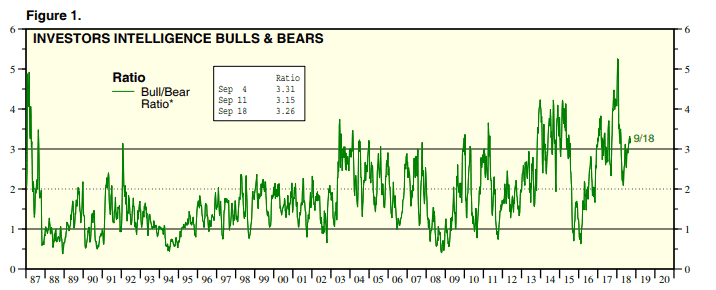
The Investor Intelligence Bull/Bear Ratio is also a weekly survey of market outlook but of institutional and hedge fund managers. While considered investment professionals, these market participants fall prey to the same economic fears and hopes as individual investors.
Using the same responses as the AAII, a ratio is determined by dividing the bullish responses by the total bullish and bearish responses. Similar to the AAII survey, the Bull/Bear Ratio can be erratic and therefore limited value in the short-term: however, a long-term analysis can illustrate extreme bullish or bearish levels (60%+ to 40%- respectively) that investors should know.
The Consumer Confidence Index is a monthly measure of 5000 households regarding their current and expected spending and savings over the next twelve months. This sample provides a snapshot of consumer optimism regarding their future purchasing behavior, which fuels the economy.
The survey’s subjective responses are converted to a number, above 100 indicating optimism and below pessimism. However, a single month’s result is meaningless; it is the trend discerned over time that provides investors with predictive knowledge of the market direction or possible reversal.

Savvy investors aware of historically extreme Consumer Confidence Index levels will be able to spot potential reversals of current market trends.
An investor selling short expects a stock or index to decline. They do not own the underlying stock or index; they are “short” it in their portfolio and must borrow the shares in order to sell them in the market. The investor closes the short position when they purchase the shares in the market, returning the shares to the institution from which they borrowed. Short sellers are therefore by definition bearish.
Short Interest is an excellent sentiment indicator excellent measuring any bearish sentiment as it is based on actual numbers. The term short interest is the total number of shares sold short divided by the total outstanding shares. The various exchanges publish a monthly short interest report.
A variant of Short Interest is the Short Interest Ratio, which divides the Short Interest by the Average Daily Trading Volume. This factors in the liquidity of the stock. If a stock trades a substantial volume each day, a high short interest may not be significant as it will not impact the price as short sellers cover.
Another short interest metric is Days To Cover, which divides total shares short by the Average Daily Trading Volume. While high short interest numbers are overall bearish, excessive days to cover can signal an over-shorted stock ripe for a short-covering rally or “short squeeze.”
Every market has a number of stocks that seemingly leads the way. They are usually widely held with strong institutional and investor ownership. These stocks used to be considered “bellwether” companies representing stable and sustainable growth. In prior markets they were railroad, auto, computer and telecom companies.
Now, they are stocks with incredible growth outlooks and media darlings, garnering attention from every news source, not just the financial press or pundits. The current bellwethers are AMZN, TSLA, GOOGL and NFLX. While possibly over-hyped, they will lead the market, up or down. Conversely, a market move will not be sustainable without their participation. Investors, even if not included in their portfolio, need to pay attention to those leading key stocks to gauge overall market sentiment.
In Summary
Technical Analysis is predominantly concerned with the interpretation of quantifiable data – price and volume. However, Market Sentiment Indicators provide qualitative provide qualitative information regarding the psychology of various market participants. Investors should be aware of these indicators as it is the fear and hope in the human psyche that propels markets to spectacular heights and depths.
Wealthplicity Recent Posts