Technical Analysis works on the premise that all fundamental information and investor expectations needed to forecast future movements are found in price volume analysis. Many investors focus only on price. This is a mistake. Both are required for a complete evaluation of price trends. Just like other various technical tools – bar charts, momentum indicators – a volume indicator can confirm and predict price movements.
When travelling over a beautiful bridge, like the Golden Gate Bridge or the Brooklyn Bridge, we marvel at the magnificent archways, cables and towers soaring above and across the waterway.
However, it is the mammoth superstructure below the waterline that supports these engineering glories. Similarly, in the market we intensely fascinate over the price movements of individual stocks and indices.
Yet, like a bridge, it is the underlying volume that determines the foundation for the success or failure of those moves. Some of the most effective and interesting Volume indicators are OBV, Money Flow, Volume Oscillators, Negative Volume Index, and Volume Weighted Average Price.
On-balance Volume (OBV) is a Momentum indicator based on volume flow. Rooted in the observation that significant volume changes will precede price reversals, it is the cumulative inflows and the outflows of a stock or index.
Inflows are days where the closing price was higher than the previous close, and outflows are where the price closes lower. These are then added or subtracted from the previous cumulative OBV. And, as with all Momentum signals, investors are looking for divergence.
It makes sense that when prices rally, inflows (more buyers than sellers) will also rise. Conversely, when stocks are selling off, the outflows will be greater than the inflows. The OBV should move in tandem with the price movement. When the price and OBV are not in sync but diverging, then a reversal is imminent. If a stock is making higher closing highs but the OBV is not, a sell off is expected. As the OBV rallies during a stock decline, investors should be watchful for an upside reversal.
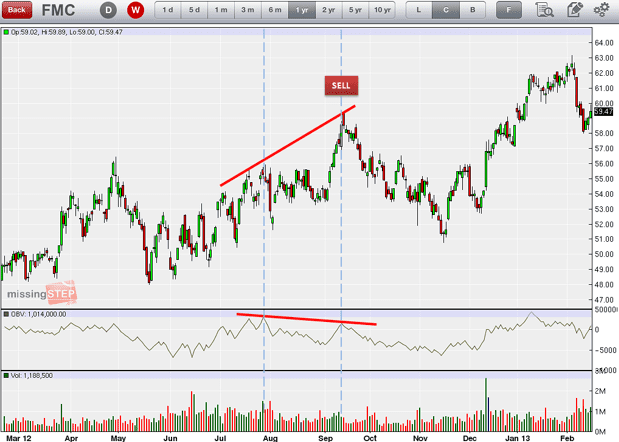
While OBV consistently validates an existing trend, it is the divergence from the price trend that makes it an effective predictive tool for investors.
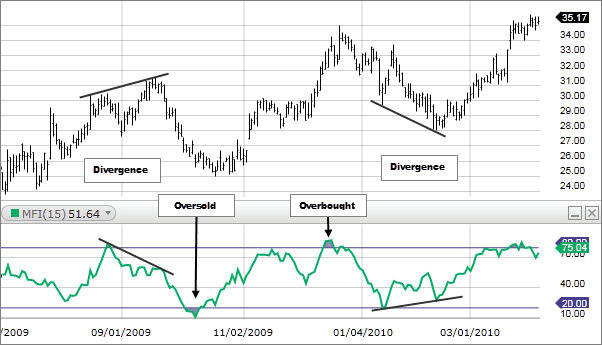
Money Flow is similar to OBV. However, Money Flow indices use calculations with both price and volume to determine a momentum oscillator. Without getting formulaic, the cumulative volume from days when the stock closes higher than the previous close is divided by the cumulative volume from down days over a period of time.
This is then placed into a ratio similar to a Relative Strength Index. Basically, this volume RSI measures the strength or weakness of a trend; whether a price move is sustainable or not.
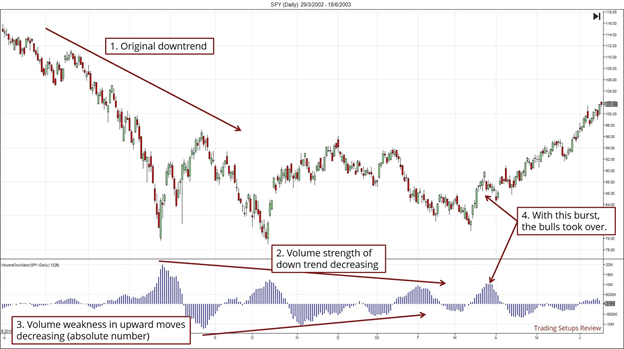
As with all oscillators, the basic structure is a shorter-term moving average compared to a longer-term moving average. This Simple Moving Average comparison provides investors with a graphic portrayal of historical volume trends and potential reversals. Volume Oscillators, however, disregard price.
The difference will indicate increasing or decreasing volumes. These can confirm an existing trend, or the divergence can indicate a price reversal. Investors should use these in conjunction with price Momentum Indicators to ensure a complete picture.
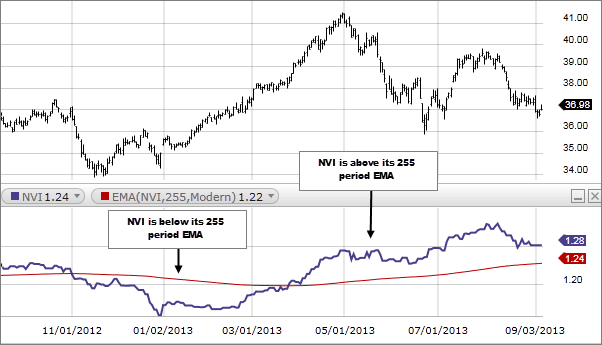
The Negative Volume Index (NVI) is an interesting indicator as it is concerned only with days of declining volume. The foundation of NVI is that the “smart” money (institutional and hedge fund portfolio managers) trading utilizes less volume to produce price moves versus the “herd” (individual retail investors).
It is a cumulative value over time that rises on days when a stock or index has a positive price change on lower volume and falls on negative changes on lower volume. As institutional investors are always in the market. However, when the crowd of individual investors are not involved, NVI may point out what stocks large fund portfolio managers are trading and whether buying or selling. These signals may be less frequent but can be rewarding for the patient and alert investor.
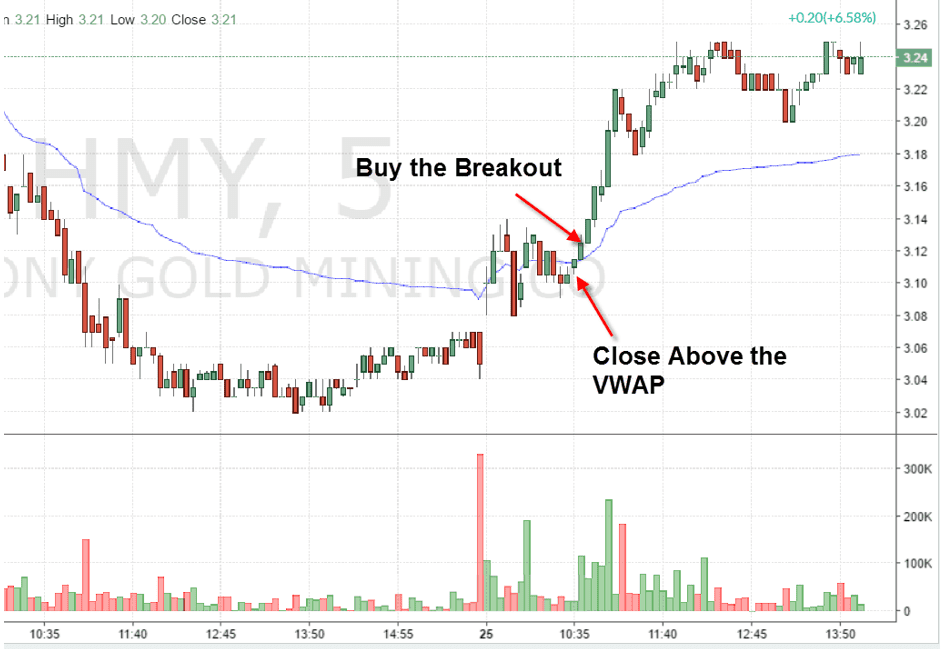
The Volume Weighted Average Price (VWAP) emphasizes the volume that trades at a price. It is different than the closing or average price. The VWAP of a stock tells investors where the market values a stock – where the most buyers and sellers are willing to trade.
While predominantly used by institutional and hedge fund traders to gauge a fair value of a stock throughout the trading day, the individual investor may also find the VWAP useful for entry and exit trades on breakouts or breakdowns. Due to its fairly short-term nature, this volume indicator should be used in conjunction with other long-term technical tools.
In Summary
Price and volume are partners in Technical Analysis. Investors must utilize Volume Indicators to fully measure and understand the strength and sustainability of trends, plus the potential reversals. Trading volume analysis helps to confirm and predict price moves. While momentum precedes price, changes in momentum precedes changes in price. And changes in volume, that seemingly underlying structure below the surface of the market, signal investors these momentum shifts.
Wealthplicity Recent Posts