Markets are made of cycles. These cycles are shaped by both economic and psychological forces. Interest rates, earnings, employment, GDP as well as the expectations, fear and greed of investors all influence the direction and magnitude of the various bull and bear cycles. One of the hardest parts of investing is knowing what cycle the market is in, and then figuring out where in that cycle. Technical Analysis helps break down the underlying mechanics of these cycles. And Momentum Indicators, along with Volume Indicators, are some of the most effective technical tools for investors to gauge the strength and pivot points of the market or individual security.
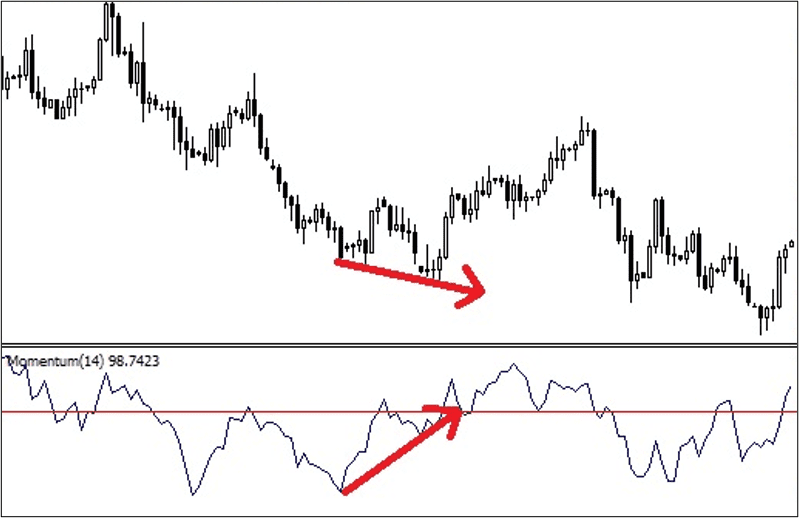
Momentum Indicators measure the rate of change of the price of a security: how high (or low) a stock moves and how fast. This determination of the velocity of the price move allows investors to ride a continuation of the momentum while seeking potential inflection points or trend reversals.
The key to predicting reversals is the divergence between a stock price and price momentum. A slowing or turn in a momentum indicator while the price trend continues signals a turn is coming. To quote George Lane, the developer of the Stochastic indicator, “Momentum always changes direction before price.”
Investors need to be aware of the momentum of the market or stock in order to profitably manage their portfolios. Several effective Momentum Indicators that can be applied across your technical analysis bar chart are:
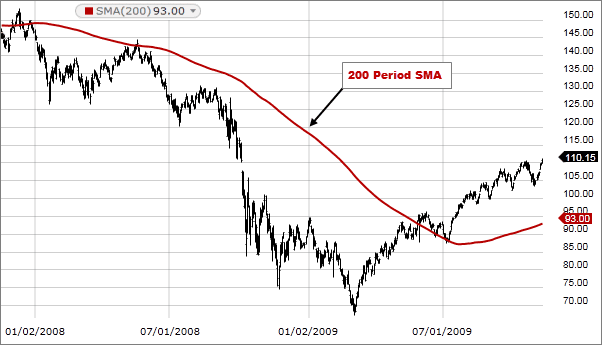
Moving averages are the most basic of Momentum Indicators. A Simple Moving Average (SMA) is the average price of an index or stock over a certain period. The time period remains the same, but the average continuously “moves” with the addition of the next time increment. They are plotted as a continuous line on a Bar Chart and visually display the overall trend of the security.
A 200 day Moving Average is used to verify long term trends, a 50 day or 65 day for intermediate trends, and shorter periods to match shorter time horizons. The longer the SMA, the smoother and “truer” the average (due to more data points). When the security price crosses the SMA to the upside, a buy signal is triggered. Conversely, a cross to the downside is a sell signal. However, the longer the SMA time period, the less sensitive it is to short term price movements.
This prevents investors from being “whipsawed” and overreacting to short term price swings. Another important indicator of a momentum shift occurs when a shorter term SMA crosses a longer term SMA. These moving average crosses help investor determine the cycle – up or down – and when it has changed.
Oscillators build upon Simple Moving Averages. In their most basic form, they are calculated by taking the difference of the SMA of the shorter time period from the SMA of the longer period. The moving averages oscillate: moving away from or converging toward each other. This difference – positive or negative – is plotted around zero.
During rising momentum and prices, the oscillator will move above zero, and below zero during a down cycle. These periods are considered “overbought” and “oversold” respectively. These overbought and oversold conditions may last indefinitely.
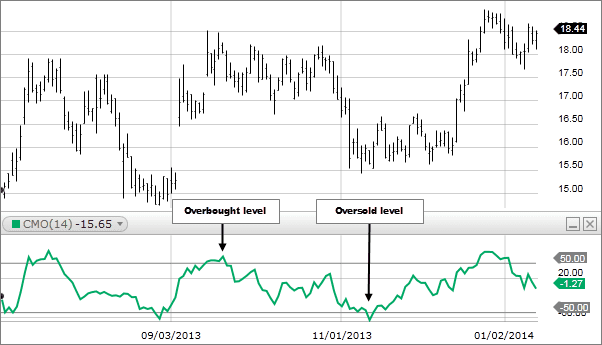
However, an investor monitoring momentum may discern a predictive pattern. Over time, an oscillator will define the overbought and oversold extremes of a security. While every cycle behaves differently, it is these outlying ranges when optimal buying and selling are found. Then, as the momentum reverses and crosses the zero line, a confirming signal occurs. A more cautious investor may wait for this confirmation to act.
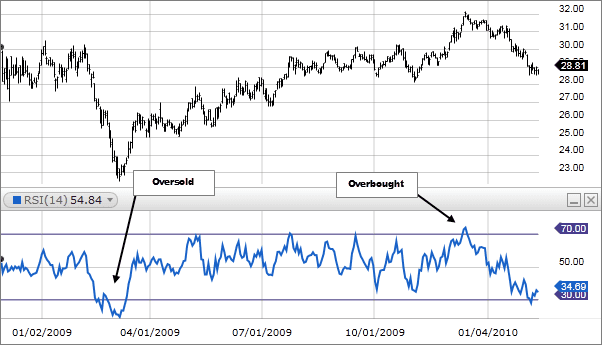
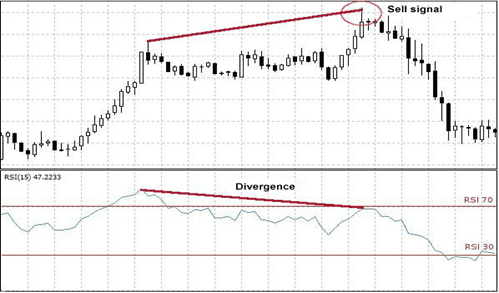
A popular Momentum Indicator is the Relative Strength Index (RSI). Instead of focusing upon price, RSI is an oscillator that looks at the difference between the average gains and average losses of a stock over a specific time period. The RSI has a scale between 0 and 100, where a value of zero occurs when there have been no gains in the time period, and 100 having only gains.
Similar to SMA Oscillators, the Relative Strength Index indicates overbought and oversold conditions, plus potential trend reversals. Simply, an RSI above 50 shows upward momentum, and above 70 a security is considered overbought. A number below 50 signifies downward momentum, with below 30 oversold.
Trend reversals may be expected during RSI Divergence in extreme conditions. As with other moving average-based technical tools, divergence by the stock price from the indicator’s direction will signal a change in trend.
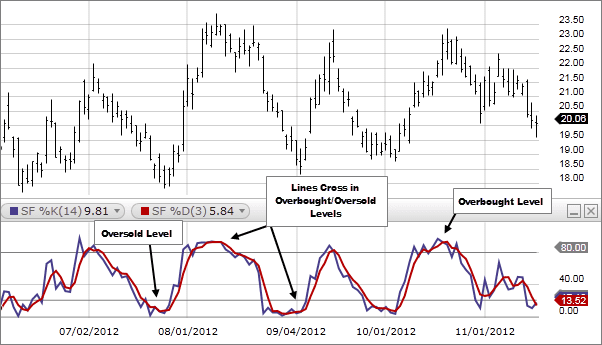
Stochastics are another useful oscillator for investors monitoring momentum. Similar to RSI, they measure the difference between moving averages.
However, stochastics utilize a formula that considers the closing price, the low price and the high price of a stock over a certain period of time. This determines the “fast” stochastic, notated as %K. Additionally, a “slow” stochastic number, known as %D, is created by extending %K by longer period moving averages. This %D stochastic provides fewer false signals due to these added data points.
When plotted, stochastics also display overbought and oversold conditions. And like RSI, inflection points for reversals occur when the oscillator lines cross during the extreme levels. Once again, investors are looking for the divergence between the price movement of the stock and the momentum to make profitable entry and exit decisions.
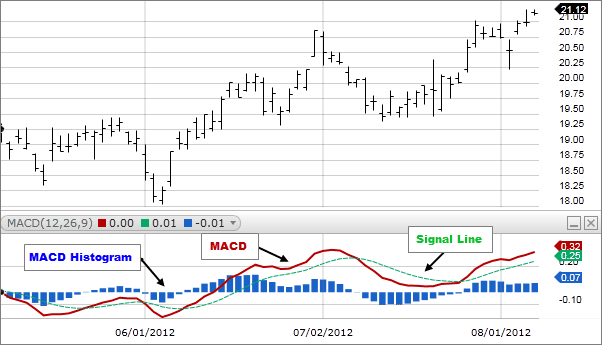
The computerization of enhanced technical tools has increased the use of MACD, which stands for Moving Average Convergence Divergence. It too is an oscillator, but with three moving averages (named MACD, Average and Divergence). MACD, however, uses exponential moving averages, which puts more weight on recent time periods.
Basically, MACD – similar to Stochastics – provides a “fast” line, a “slow” line and a divergence measurement of the two, usually depicted by a histogram. The investor is looking for times of extreme divergence to act, confirmed by a cross by the fast line over the slow line, signaling a trend reversal.
As markets have become more automated by AI and algorithms, they have become more linear, with similar inputs and models creating likeminded portfolios. This computerization has created fewer but extremely forceful moves up and down.
The prudent investor must still maintain awareness and understanding of these market cycles and when they shift in order to grow and sustain their wealth. And by measuring the velocity of prices, Momentum Indicators allow investors to maintain their portfolios through a continuation of up cycles while acknowledging inflection points into down cycles.
Wealthplicity Recent Posts