Markets are cycles. They expand and contract spurred on by various economic conditions, government policies plus corporate, consumer and investor psychology. The current market has surged 84% from the pandemic lows fifteen months ago, and 450% from the bottom of the Financial Crisis in early 2009. This cycle has produced an impressive average annual return of 37% over more than twelve years. And while the market may continue to grind higher on the back of historically low interest rates, there are three factors looming that may combine to trigger a trend reversal: inflation, the Fed, and the supply of shares.
Let’s take a close look at all three factors and the possible impact on the stock market.
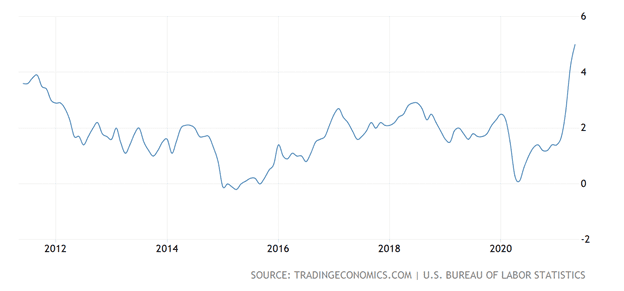
There has been constant discussion by the media and market pundits about the current upswing in inflation. Many, including the Fed, declare that the rise is transitory, reflective of pandemic-related supply chain issues, and will return to lower manageable levels. Others believe a decade-plus of low interest rates and a post-COVID resurgent economy are fueling increased demand. Either way, as the annual inflation rate increased to 5% in May from 4.2% in April, everyone agrees that the economy is presently experiencing price inflation.
Historically, accelerating inflation from moderate levels during an economic recovery was considered a positive sign of expansion. And it is a good indicator now as well. Yet, during the prevailing T.I.N.A. (There Is No Alternative) equity markets’ surge, investors have assumed low interest rates indefinitely. Unfortunately, any signal that the Fed will change course and raise rates in the near future will impact investment outlooks and econometric models, increasing the return expectations of fixed income alternatives. (See our essay “Can The Fed Save T.I.N.A.”) This will negatively impact the market.
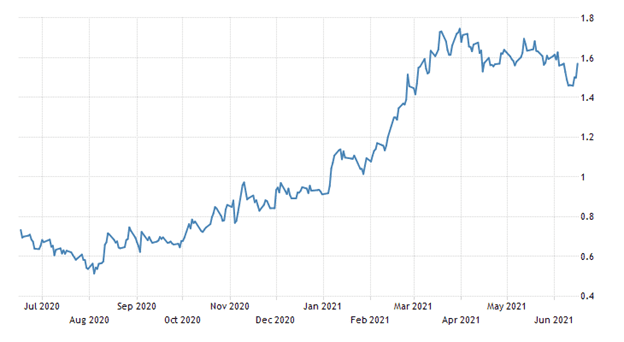
As it will take months of data to verify whether the current pricing pressures are temporary, investors should evaluate both viewpoints. The transitory camp testifies that most of the price increases have been in those sectors most impacted by the pandemic (used cars, air traffic, hotels, etc.) and are rebounding back to normalized levels after being decimated last year. They also point to the U.S. Treasury 10-year bond yield which has actually declined during the recent inflation rally.
The bond market seemingly agrees with the Fed that these inflationary pressures are temporary. Or it may be more mechanical, due to the Treasury’s $1 trillion General Account rundown before the August debt ceiling deadline, inundating money markets with reserves. But another interesting interpretation is that even at current yields, the U.S. 10-year bonds are attractive to foreign investment managers, especially European and Japanese, seeking relatively higher yields than found in their domestic markets.
Commodity prices had been soaring, with key industrial components lumber, copper and oil all with healthy if not parabolic moves. Recently though, both lumber and copper have pulled back dramatically from their highs as hoarded inventories and reestablished supply chains finally met demand. However, at $1,000 lumber is still well above the prior six-year average of approximately $450, and copper at $9500 is also firmly above the six-year average of nearly $5200.
Also, companies are starting to pass on higher production costs – raw materials and wages – to consumers. Many food companies have lately raised prices due to significant increases in commodity, transport and labor costs. And they expect these cost increases to continue through the year.
These price boosts indicate powerful consumer demand, which is necessary for economic expansion.
However, expectations of continued inflationary pressures can alter wage and pricing behavior and become self-fulfilling. As the esteemed JPMorgan CEO Jamie Dimon recently stated, there is “a very good chance inflation will be more than transitory.” And Barclays Bank now expects annual inflation to be 3.6% in the fourth quarter, which is almost double the Federal Reserve’s 2% target. If these inflationary forecasts continue, the Fed – who actually indicated such at their recent FOMC meeting – may be forced to raise rates sooner than the market expects.
Unfortunately, the Fed has currently backed itself into a corner. By focusing upon the elusive maximum employment as a necessary achievement before any interest rate hikes, they are allowing inflationary pressures to remain unchecked. In 2019 and pre-pandemic, the U.S. unemployment rate averaged 3.7%. Today, with near-zero interest rates, increasing vaccinations and roughly $4 billion of stimulus spending, unemployment has dropped dramatically from its COVID highs.
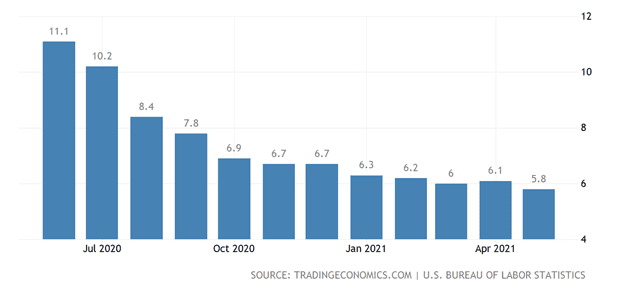
However, with the current rate at 5.8%, pre-pandemic levels (our assumptive maximum employment) seem difficult to achieve.
Job creation remains slippery for a number of reasons. One issue the Fed alluded to is the magnitude of retirements, exacerbated by the pandemic. With an aging population, many economists are doubtful that pre-pandemic levels of unemployment are realistically achievable. Fed Chairman Jerome Powell actually admitted “we don’t actually know exactly what labor-force participation will be as we go forward.” That is problematic when your mandate has become full employment.
Another factor affecting employment is whether the stimulus is encouraging unemployed workers not to seek employment. With approximately 9 million job openings and 9 million people unemployed, there must be something holding back job seekers from entering the workforce. Currently, governors in twenty-five states have or will be halting the pandemic-related $300 per week unemployment benefit in an effort to incent the unemployed back to work.
With the economy already experiencing inflationary green shoots, the resultant wage inflation – already increasing as employers attempt to entice workers – will fuel demand-push pricing pressures. The Fed must consider this potential for rapid wage growth. By concentrating on the admitted ambiguous concept of full employment, the Fed is allowing inflation to gain traction beyond transitory effects. It has placed itself in a damned if they do, damned if they don’t situation. They may raise rates to stifle any chance for unhealthy inflation growth, but potentially choke off the economic recovery. Or they can let inflation run as they wait for an uncertain maximum employment measure that is difficult to determine.
Either way the Fed will be raising rates. They can lift them gradually as in the 2013 “Taper Tantrum” where, after an initial 5% hit to equities, the economy and stock market rebounded nicely.
Investors should be aware, however, that with the S&P 500 P/E Ratio now at extreme levels, the markets may pullback more sharply. But the financial system, as in 2013, will eventually bounce back. Conversely, if the Fed waits, we could see the destructive nature of unchecked inflation, with an extreme example being 1973/1974, accompanied by a 45% correction.
The issues of inflation and rising rates have been debated many times in various media venues for some time. Yet, an unspoken factor constantly at play in the market is the basic economic principle of supply and demand. For normal goods and services, the supply/demand curve has price declining as either demand falls or supply rises, or price rising if demand increases or supply decreases.
However, the stock market is different. Due to the psychological influences of fear and greed (and today’s FOMO), demand for stocks actually increases as prices rise. It is a unique phenomenon in economics. Unfortunately, it is not constant.
There is the story of a well-known, successful portfolio manager before the digital era and PDF documents. Back then, investment banks would mail to clients the prospectus of each IPO and/or secondary offering. These prospectuses are describing documents and would include an overview and history of the company, the company’s services or products, the management team bios, the deal structure, the use of the proceeds, the offering details, the current financial statements, and the risks involved.
This portfolio manager would accept each prospectus and stack them upon each other on the floor next to his desk. At some point, the stack would reach a height where it could no longer maintain balance and collapsed. When that happened, he would trim positions and raise cash, often before a market correction. He reasoned that his prospectus tower represented the increase in shares coming to the market, and at some tipping point it would overwhelm investor demand for stocks.
We no longer receive most prospectuses through the mail. But investors should be aware of the volume of new shares that have recently come to the market, and what is expected. These new issuances of equities may be from Initial Public Offerings (IPO), the current rage of special purpose acquisition companies (SPAC), or existing public companies offering additional shares, known as secondary offerings. At extended market valuations, companies are motivated to offer shares, IPOs or secondaries, in order to obtain the highest prices possible. The current market is no exception.
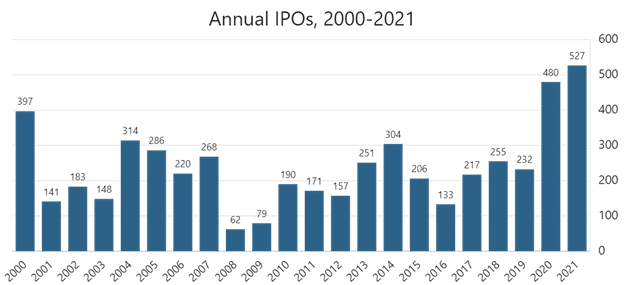
In 2020 and 2021 to date, there has already been almost the same number of companies brought to the market as the prior five years combined. And while dipping somewhat last year from record levels in 2019, the secondary issuance market is expected to hit new record volume levels in 2021.
Some will point to the surge in corporate buybacks as a major reduction in shares in the marketplace. This wave of buybacks since recovering from the Financial Crisis in 2010 has certainly reduced the available share count. However, buybacks peaked at over $800 billion in early 2019 and have declined to roughly $500 billion currently. At the same time, total equity issuance has ballooned to almost $500 billion, basically offsetting the buybacks. And with companies expected to continue offering shares at these extended valuations through 2021, the supply of shares may overcome investor demand.
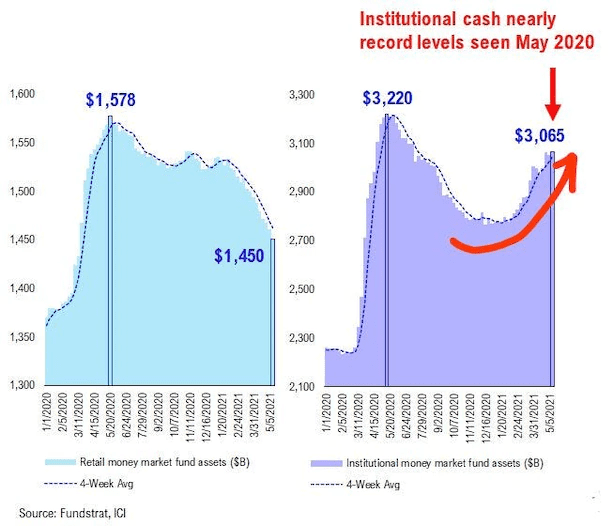
Another viewpoint is the resurgence of retail investor demand exemplified by the explosive rally of the so-called meme Stocks. Money market balances of retail investors has fallen approximately $76 billion in 2021. As money market balances are considered cash balances, it can be assumed that retail investors have put $76 billion to work in the market, predominantly chasing meme-type momentum stocks. However, at the same time institutional investors have increased their money market balances to almost $3 trillion, nearly at the pandemic levels in May of 2020.
More than a few believe that the institutional cash on the sidelines will eventually enter the market and fuel a new surge. That may be the case. But as stated in the beginning, the market has almost doubled from those pandemic lows, and those cash levels represent only roughly 6% of the U.S. stock market total capitalization. Institutional investors, as well as corporations, may look for more attractive valuations before putting their money back into the market.
In Summary
The Fed will inevitably raise rates in response to impending inflation, either sooner and relatively manageable, or later and more problematic. And the supply of shares in the market has recently grow at a dramatic and historic pace. At current market levels prudent investors must be aware of these factors.
Wealthplicity Recent Posts